Empact
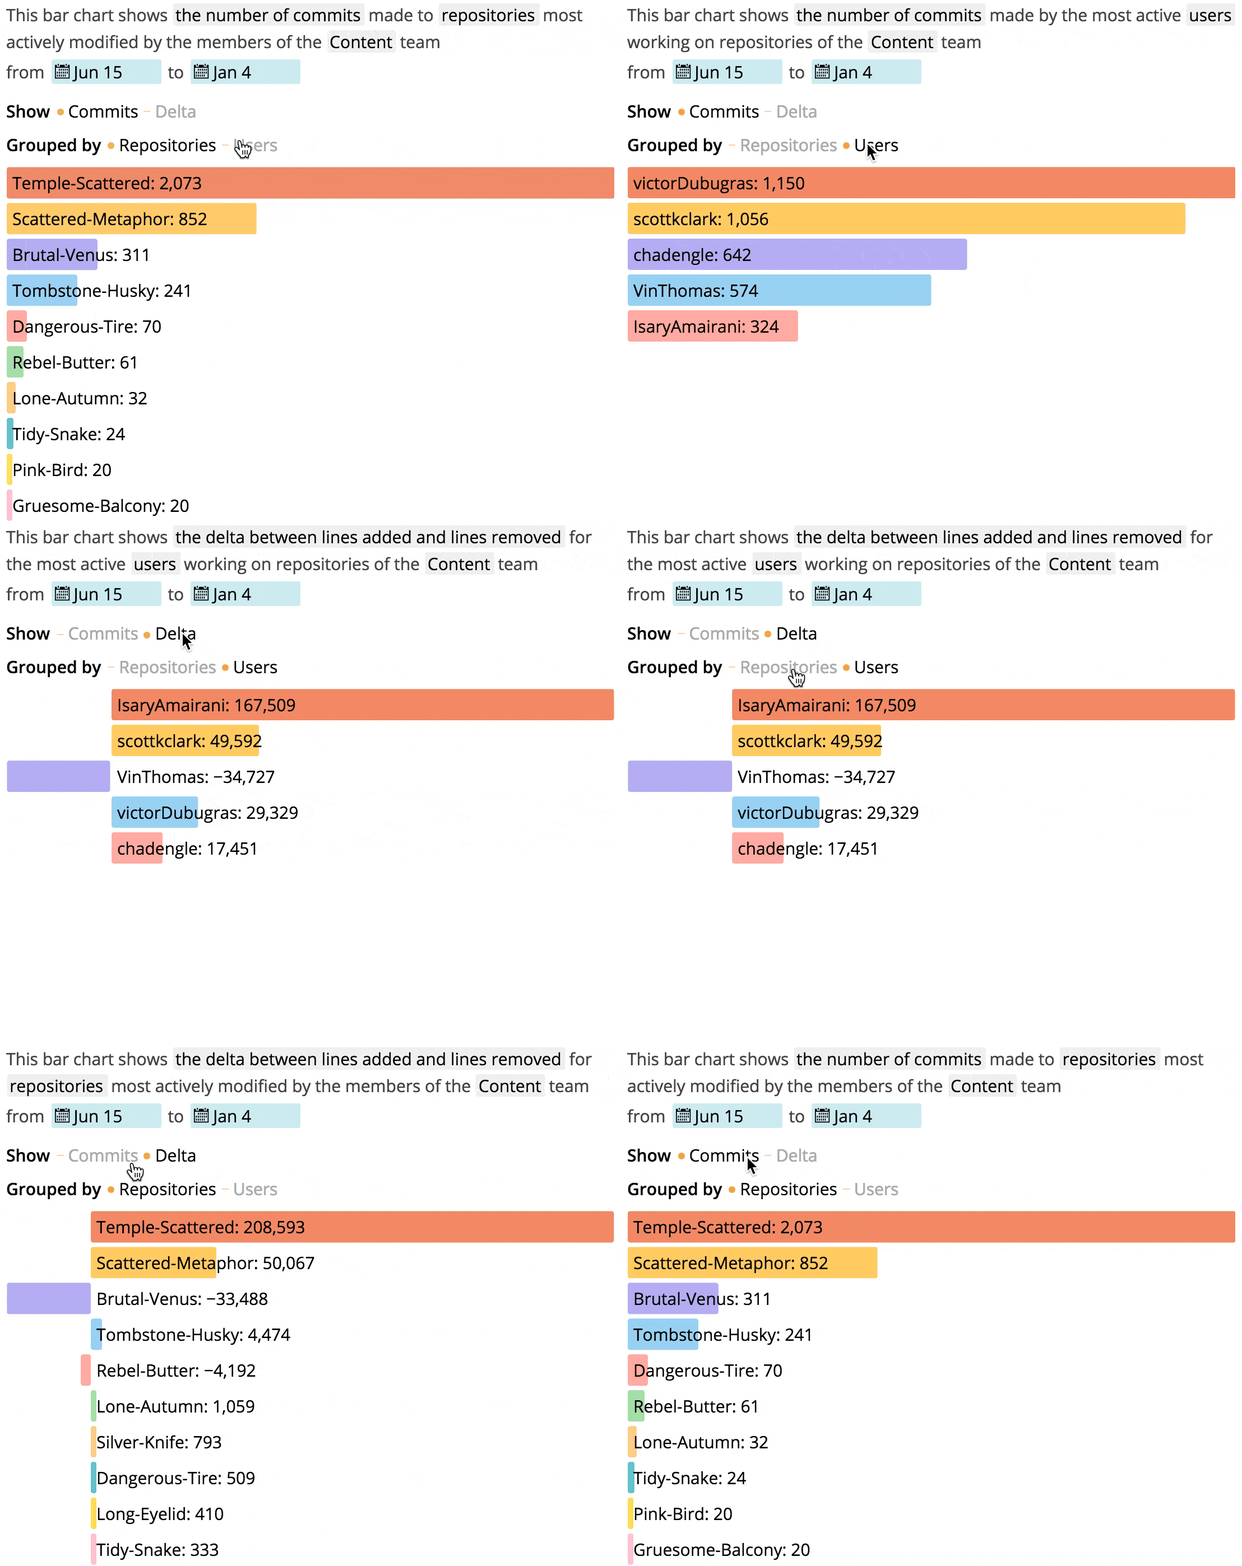
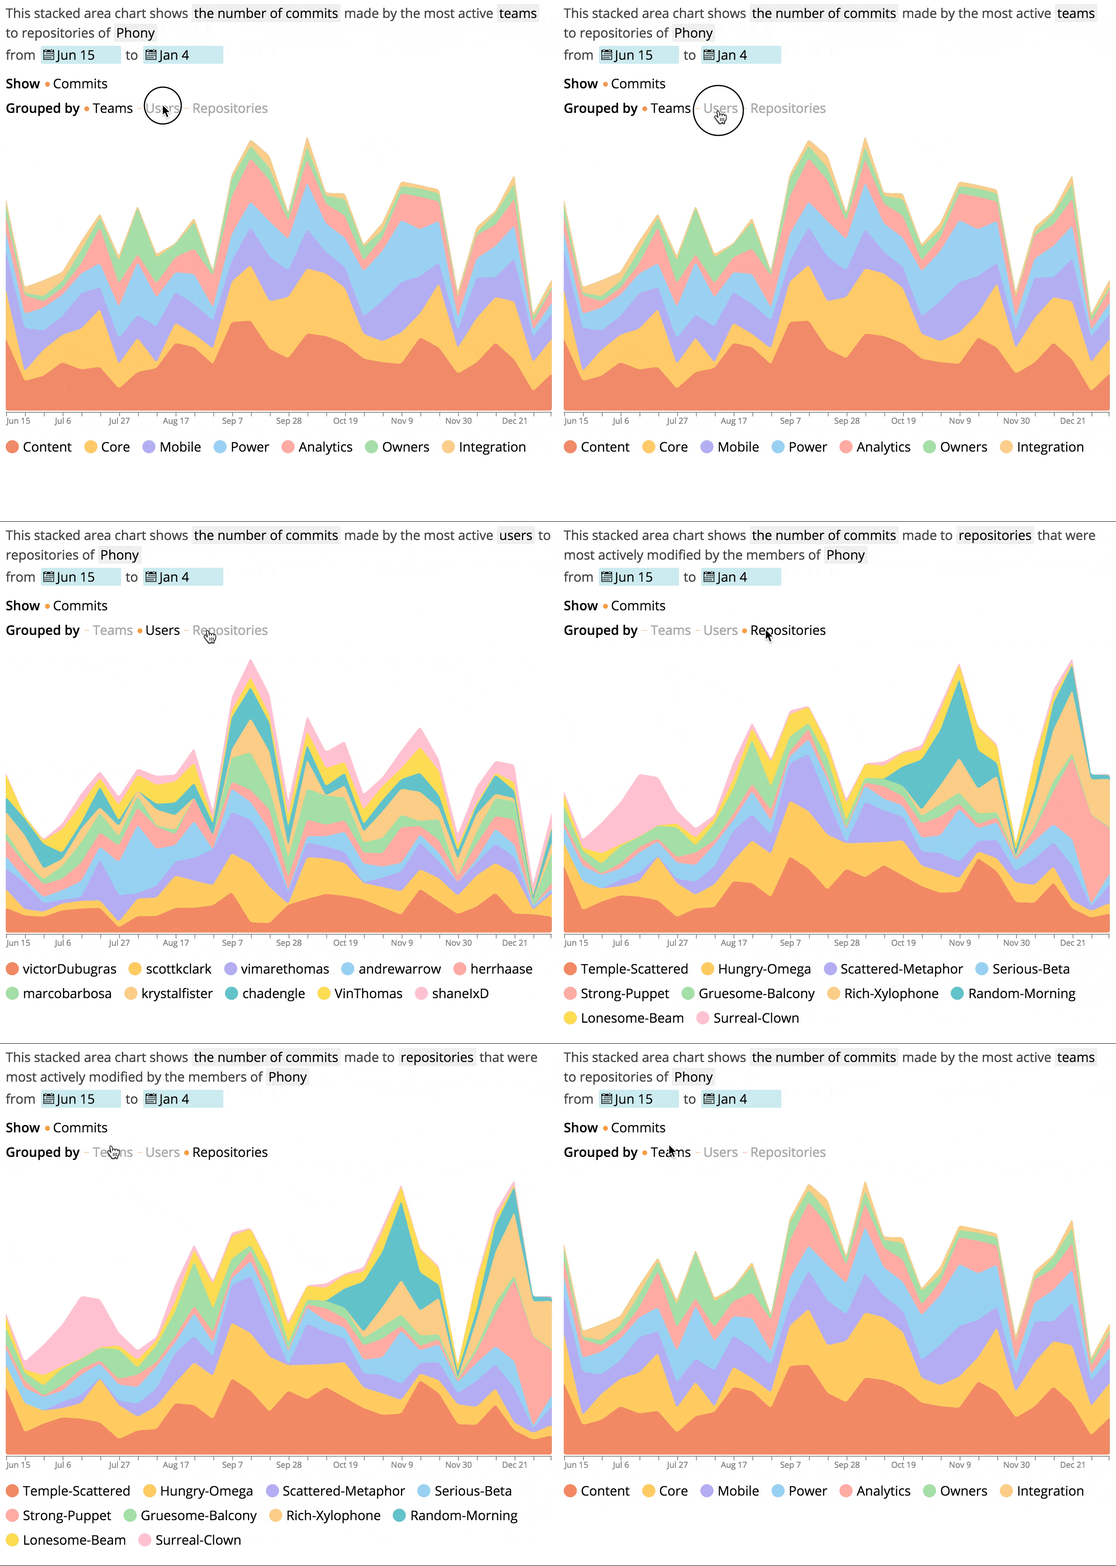
Empact allows you to take a look at developers' impact on the repositories of the company from all the different perspectives. It visualizes the contribution data gathered from the GitHub API and presents it in a couple of cool charts.

In order to visualize the data, two types of charts are used: the bar chart and the stacked area chart.

The back-end server is written in Go. The front-end application is built with React.js; charts are drawn in SVG.
At this point, the project is a working prototype, although most of its features are already complete. Data synchronization is mostly done, keeping data up-to-date is yet to be implemented.
Works best in Google Chrome, Safari has animation issues, Firefox and others have not been thoroughly tested yet.